
Page 56 - Arvind 2024
P. 56
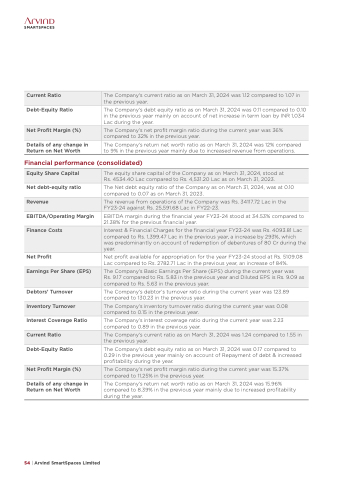
   Current Ratio
The Company's current ratio as on March 31, 2024 was 1.12 compared to 1.07 in the previous year.
   Debt-Equity Ratio
Details of any change in Return on Net Worth
The Company’s debt equity ratio as on March 31, 2024 was 0.11 compared to 0.10 in the previous year mainly on account of net increase in term loan by INR 1,034 Lac during the year.
The Company’s return net worth ratio as on March 31, 2024 was 12% compared to 9% in the previous year mainly due to increased revenue from operations.
 Net Profit Margin (%)
  The Company’s net profit margin ratio during the current year was 36% compared to 32% in the previous year.
   Financial performance (consolidated)
 Equity Share Capital
  The equity share capital of the Company as on March 31, 2024, stood at Rs. 4534.40 Lac compared to Rs. 4,531.20 Lac as on March 31, 2023.
  Net debt-equity ratio
EBITDA/Operating Margin
Net Profit
Debtors’ Turnover
Interest Coverage Ratio
Debt-Equity Ratio
Details of any change in Return on Net Worth
The Net debt equity ratio of the Company as on March 31, 2024, was at 0.10 compared to 0.07 as on March 31, 2023.
EBITDA margin during the financial year FY23-24 stood at 34.53% compared to 21.38% for the previous financial year.
Net profit available for appropriation for the year FY23-24 stood at Rs. 5109.08 Lac compared to Rs. 2782.71 Lac in the previous year, an increase of 84%.
The Company’s debtor’s turnover ratio during the current year was 123.89 compared to 130.23 in the previous year.
The Company’s interest coverage ratio during the current year was 2.23 compared to 0.89 in the previous year.
The Company’s debt equity ratio as on March 31, 2024 was 0.17 compared to 0.29 in the previous year mainly on account of Repayment of debt & increased profitability during the year.
The Company’s return net worth ratio as on March 31, 2024 was 15.96% compared to 8.39% in the previous year mainly due to increased profitability during the year.
 Revenue
  The revenue from operations of the Company was Rs. 34117.72 Lac in the FY23-24 against Rs. 25,591.68 Lac in FY22-23.
   Finance Costs
 Interest & Financial Charges for the financial year FY23-24 was Rs. 4093.81 Lac compared to Rs. 1,399.47 Lac in the previous year, a increase by 293%, which was predominantly on account of redemption of debentures of 80 Cr during the year.
   Earnings Per Share (EPS)
 The Company’s Basic Earnings Per Share (EPS) during the current year was
Rs. 9.17 compared to Rs. 5.83 in the previous year and Diluted EPS is Rs. 9.09 as compared to Rs. 5.63 in the previous year.
  Inventory Turnover
  The Company’s inventory turnover ratio during the current year was 0.08 compared to 0.15 in the previous year.
   Current Ratio
The Company’s current ratio as on March 31, 2024 was 1.24 compared to 1.55 in the previous year.
    Net Profit Margin (%)
  The Company’s net profit margin ratio during the current year was 15.37% compared to 11.25% in the previous year.
   54 | Arvind SmartSpaces Limited
