
Page 55 - Arvind 2024
P. 55
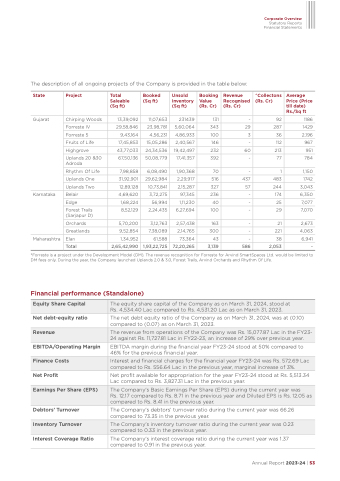
     The description of all ongoing projects of the Company is provided in the table below:
Corporate Overview
Statutory Reports Financial Statements
Average Price (Price till date) Rs./Sq ft
92 1186
287 1429
36 2,196
112 967
213 951
77 784
1 1,150
483 1742
244 3,043
174 6,350
25 7,077
29 7,070
21 2,673
221 4,063
38 6,941
2,053 -
   Project
   Total Saleable (Sq ft)
   Booked (Sq ft)
   Unsold Inventory (Sq ft)
    Booking Value (Rs. Cr)
  Revenue Recognised (Rs. Cr)
    ^Collectons (Rs. Cr)
  State
Gujarat
Chirping Woods
Forreste IV
Forreste 5
Fruits of Life
13,39,092
29,58,846
9,43,164
17,45,853
11,07,653
23,98,781
4,56,231
15,05,286
24,34,536
50,08,779
6,08,490
29,62,984
10,73,841
3,72,275
56,994
2,24,435
3,12,763
7,38,089
61,588
231439
5,60,064
4,86,933
2,40,567
19,42,497
17,41,357
1,90,368
2,29,917
2,15,287
97,345
1,11,230
6,27,694
2,57,438
2,14,765
73,364
131 -
343 29
100 3
146 -
232 60
392 -
70 -
516 437
327 57
236 -
40 -
100 -
163 -
300 -
43 -
3,139 586
      Highgrove 43,77,033
 Uplands 20 &30 Adroda
Rhythm Of Life
Uplands One
Uplands Two
67,50,136
7,98,858
31,92,901
12,89,128
    Karnataka
Maharashtra
Belair 4,69,620
Edge 1,68,224
Forest Trails 8,52,129 (Sarjapur D)
Orchards 5,70,200
Greatlands 9,52,854
Elan 1,34,952
      Total 2,65,42,990 1,93,22,725 72,20,265
 *Forreste is a project under the Development Model (DM). The revenue recognition for Forreste for Arvind SmartSpaces Ltd. would be limited to DM fees only. During the year, the Company launched Uplands 2.0 & 3.0, Forest Trails, Arvind Orchards and Rhythm Of Life.
Financial performance (Standalone)
 Equity Share Capital
  The equity share capital of the Company as on March 31, 2024, stood at Rs. 4,534.40 Lac compared to Rs. 4,531.20 Lac as on March 31, 2023.
  Net debt-equity ratio
EBITDA/Operating Margin
Net Profit
Debtors’ Turnover
Interest Coverage Ratio
The net debt equity ratio of the Company as on March 31, 2024, was at (0.10) compared to (0.07) as on March 31, 2023.
EBITDA margin during the financial year FY23-24 stood at 50% compared to 46% for the previous financial year.
Net profit available for appropriation for the year FY23-24 stood at Rs. 5,513.34 Lac compared to Rs. 3,827.31 Lac in the previous year.
The Company's debtors’ turnover ratio during the current year was 66.26 compared to 73.35 in the previous year.
The Company's interest coverage ratio during the current year was 1.37 compared to 0.91 in the previous year.
 Revenue
  The revenue from operations of the Company was Rs. 15,077.87 Lac in the FY23- 24 against Rs. 11,727.81 Lac in FY22-23, an increase of 29% over previous year.
  Finance Costs
  Interest and financial charges for the financial year FY23-24 was Rs. 572.69 Lac compared to Rs. 556.64 Lac in the previous year, marginal increase of 3%.
  Earnings Per Share (EPS)
 The Company's Basic Earnings Per Share (EPS) during the current year was
Rs. 12.17 compared to Rs. 8.71 in the previous year and Diluted EPS is Rs. 12.05 as compared to Rs. 8.41 in the previous year.
  Inventory Turnover
  The Company's inventory turnover ratio during the current year was 0.23 compared to 0.33 in the previous year.
   Annual Report 2023-24 | 53
