
Page 269 - Arvind 2024
P. 269
Corporate Overview Statutory Reports Financial Statements
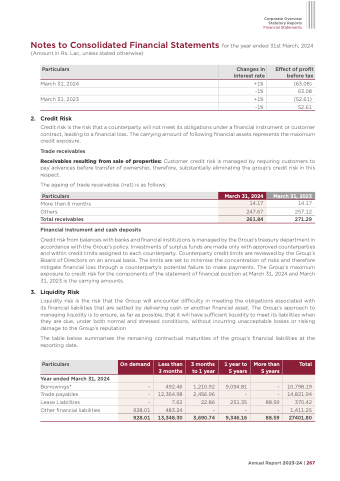
Notes to Consolidated Financial Statements for the year ended 31st March, 2024 (Amount in Rs. Lac, unless stated otherwise)
Particulars
Changes in interest rate
Effect of profit before tax
March 31, 2024 March 31, 2023
2. Credit Risk
+1% (63.08)
-1% 63.08
+1% (52.61)
-1% 52.61
Credit risk is the risk that a counterparty will not meet its obligations under a financial instrument or customer contract, leading to a financial loss. The carrying amount of following financial assets represents the maximum credit exposure.
Trade receivables
Receivables resulting from sale of properties: Customer credit risk is managed by requiring customers to pay advances before transfer of ownership. therefore, substantially eliminating the group’s credit risk in this respect.
The ageing of trade receivables (net) is as follows:
More than 6 months Others
Total receivables
Financial Instrument and cash deposits
14.17 257.12 271.29
Particulars
Credit risk from balances with banks and financial institutions is managed by the Group’s treasury department in accordance with the Group’s policy. Investments of surplus funds are made only with approved counterparties and within credit limits assigned to each counterparty. Counterparty credit limits are reviewed by the Group’s Board of Directors on an annual basis. The limits are set to minimise the concentration of risks and therefore mitigate financial loss through a counterparty’s potential failure to make payments. The Group’s maximum exposure to credit risk for the components of the statement of financial position at March 31, 2024 and March 31, 2023 is the carrying amounts.
3. Liquidity Risk
Liquidity risk is the risk that the Group will encounter difficulty in meeting the obligations associated with its financial liabilities that are settled by delivering cash or another financial asset. The Group’s approach to managing liquidity is to ensure, as far as possible, that it will have sufficient liquidity to meet its liabilities when they are due, under both normal and stressed conditions, without incurring unacceptable losses or risking damage to the Group‘s reputation
The table below summarises the remaining contractual maturities of the group’s financial liabilities at the reporting date.
Year ended March 31, 2024
Borrowings*
Trade payables
Lease Liabilities
Other financial liabilities
March 31, 2024
March 31, 2023
14.17
247.67
261.84
Particulars
On demand
Less than 3 months
3 months to 1 year
1 year to 5 years
More than 5 years
Total
-
492.46
1,210.92
9,094.81
-
10,798.19
-
12,364.98
2,456.96
-
-
14,821.94
-
7.62
22.86
251.35
88.59
370.42
928.01
928.01
483.24
3,690.74
-
9,346.16
-
88.59
-
1,411.25
13,348.30
27401.80
Annual Report 2023-24 | 267
