
Page 261 - Arvind 2024
P. 261
Corporate Overview Statutory Reports Financial Statements
Notes to Consolidated Financial Statements for the year ended 31st March, 2024 (Amount in Rs. Lac, unless stated otherwise)
Particulars
Balance sheet
Other comprehensive income
Statement of profit and loss
As at March 31, 2024
As at March 31, 2023
For the year 2023-24
For the year 2022-23
For the year 2023-24
For the year 2022-23
116.59
85.82
11.10
5.72
(19.67)
2,593.61
3,005.26
-
-
411.65
2,710.21
3,091.08
-
-
391.98
-
-
11.10
5.72
401.28
2,651.72
3,041.91
-
-
-
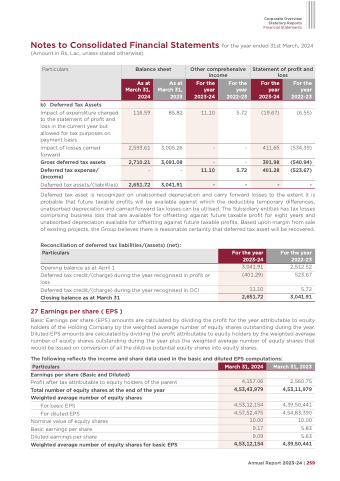
b) Deferred Tax Assets
Impact of expenditure charged to the statement of profit and loss in the current year but allowed for tax purposes on payment basis
Impact of losses carried forward
Gross deferred tax assets Deferred tax expense/ (income)
Deferred tax assets/(liabilities)
(6.55)
(534.39)
(540.94) (523.67)
-
Deferred tax asset is recognized on unabsorbed depreciation and carry forward losses to the extent it is probable that future taxable profits will be available against which the deductible temporary differences, unabsorbed depreciation and carried forward tax losses can be utilised. The Subsidiary entities has tax losses comprising business loss that are available for offsetting against future taxable profit for eight years and unabsorbed depreciation available for offsetting against future taxable profits. Based upon margin from sale of existing projects, the Group believes there is reasonable certainty that deferred tax asset will be recovered.
Reconciliation of deferred tax liabilities/(assets) (net):
Opening balance as at April 1
Deferred tax credit/(charge) during the year recognised in profit or loss
Deferred tax credit/(charge) during the year recognised in OCI Closing balance as at March 31
27 Earnings per share ( EPS )
2,512.52 523.67
5.72
3,041.91
Particulars
For the year 2023-24
For the year 2022-23
3,041.91
(401.29)
11.10
2,651.72
Basic Earnings per share (EPS) amounts are calculated by dividing the profit for the year attributable to equity holders of the Holding Company by the weighted average number of equity shares outstanding during the year. Diluted EPS amounts are calculated by dividing the profit attributable to equity holders by the weighted average number of equity shares outstanding during the year plus the weighted average number of equity shares that would be issued on conversion of all the dilutive potential equity shares into equity shares.
The following reflects the income and share data used in the basic and diluted EPS computations:
Particulars
March 31, 2024
March 31, 2023
Earnings per share (Basic and Diluted)
Profit after tax attributable to equity holders of the parent
Total number of equity shares at the end of the year Weighted average number of equity shares
For basic EPS
For diluted EPS
Nominal value of equity shares
Basic earnings per share
Diluted earnings per share
Weighted average number of equity shares for basic EPS
2,560.75
4,53,11,979
4,39,50,441 4,54,83,390 10.00 5.83 5.63 4,39,50,441
4,157.06
4,53,43,979
4,53,12,154
4,57,52,475
10.00
9.17
9.09
4,53,12,154
Annual Report 2023-24 | 259
