
Page 201 - Arvind 2024
P. 201
Corporate Overview Statutory Reports Financial Statements
Notes to Standalone Financial Statements for the year ended 31st March, 2024 (Amount in Rs. Lac, unless stated otherwise)
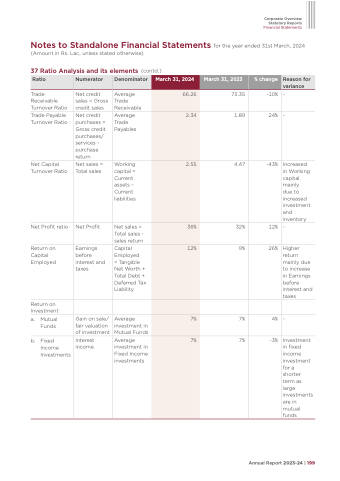
37 Ratio Analysis and its elements (contd.)
Trade Receivable Turnover Ratio Trade Payable Turnover Ratio
Net Capital Turnover Ratio
Net Profit ratio
Return on Capital Employed
Return on Investment
a. Mutual Funds
b. Fixed Income
Investments
- -
Increased in Working capital mainly
due to increased investment and inventory
-
Higher return mainly due to increase in Earnings before interest and taxes
-
Investment in fixed income investment for a shorter term as large investments are in mutual funds
Ratio
Numerator
Denominator
March 31, 2024
66.26
March 31, 2023
73.35
% change
Reason for variance
Net credit sales = Gross credit sales
Average Trade Receivable
-10%
Net credit purchases = Gross credit purchases/ services - purchase return
Average Trade Payables
2.34
1.89
24%
Net sales = Total sales
Working capital = Current assets – Current liabilities
2.55
4.47
-43%
Net Profit
Net sales = Total sales - sales return
36%
32%
12%
Earnings before interest and taxes
Capital Employed
= Tangible Net Worth + Total Debt + Deferred Tax Liability
12%
9%
26%
Gain on sale/ fair valuation of investment
Average investment in Mutual Funds
7%
7%
4%
Interest income
Average investment in Fixed Income investments
7%
7%
-3%
Annual Report 2023-24 | 199
