
Page 200 - Arvind 2024
P. 200
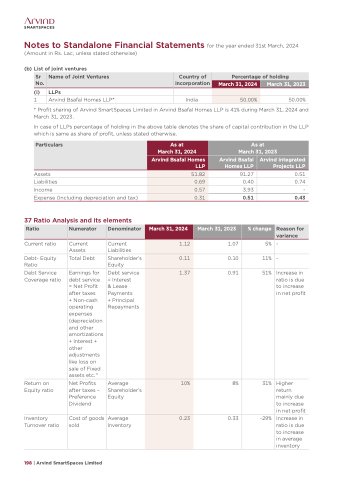
Notes to Standalone Financial Statements for the year ended 31st March, 2024 (Amount in Rs. Lac, unless stated otherwise)
(b) List of joint ventures
(i) LLPs
1 Arvind Bsafal Homes LLP* India 50.00%
* Profit sharing of Arvind SmartSpaces Limited in Arvind Bsafal Homes LLP is 41% during March 31, 2024 and March 31, 2023.
In case of LLPs percentage of holding in the above table denotes the share of capital contribution in the LLP which is same as share of profit, unless stated otherwise.
 Sr No.
Name of Joint Ventures
Country of incorporation
Percentage of holding
    March 31, 2024
March 31, 2023
         50.00%
   Particulars
As at March 31, 2024
Arvind Bsafal Homes LLP
As at March 31, 2023
   Arvind Bsafal Homes LLP
Arvind Integrated Projects LLP
    51.82
 0.69
 0.57
 0.31
   Assets 91.27
Liabilities 0.40
Income 3.93
0.51
0.74
-
0.43
Increase in ratio is due to increase in net profit
      Expense (Including depreciation and tax)
37 Ratio Analysis and its elements
0.51
      Ratio
Numerator
Denominator
March 31, 2024
March 31, 2023
% change
Reason for variance
          Current Assets
Current Liabilities
1.12
1.07 5%
    0.11
         Earnings for debt service = Net Profit after taxes
+ Non-cash operating expenses (depreciation and other amortizations + Interest + other adjustments like loss on sale of Fixed assets etc."
Debt service = Interest
& Lease Payments
+ Principal Repayments
1.37
0.91
51%
         Net Profits after taxes – Preference Dividend
Average Shareholder’s Equity
10%
8%
31%
         Cost of goods sold
Average Inventory
0.23
0.33
-29%
        Current ratio
Debt- Equity Ratio
Debt Service Coverage ratio
Total Debt
Shareholder’s Equity
0.10
11%
-
-
      Return on Equity ratio
Inventory Turnover ratio
Higher return mainly due to increase in net profit Increase in ratio is due to increase in average inventory
    198 | Arvind SmartSpaces Limited
