
Page 119 - Arvind 2024
P. 119
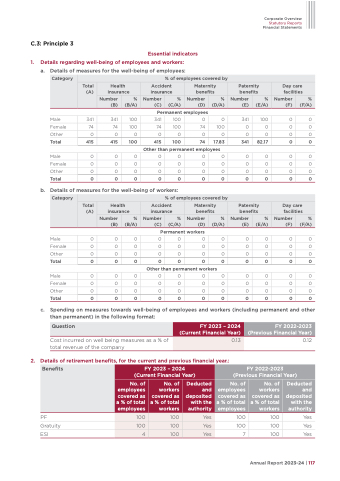
     C.3: Principle 3
Essential indicators 1. Details regarding well-being of employees and workers:
a. Details of measures for the well-being of employees:
Permanent employees
Male 341 341 100 341 100 0 0
Female 74 74 100 74 100 74 100
341 100
0 0
0 0
0 0
Corporate Overview
Statutory Reports
Financial Statements
 Category
 % of employees covered by
 Total (A)
  Health insurance
 Accident insurance
 Maternity benefits
 Paternity benefits
 Day care facilities
 Number (B)
  % (B/A)
  Number (C)
  % (C/A)
  Number (D)
  % (D/A)
  Number (E)
  % (E/A)
  Number (F)
  % (F/A)
     Other 00000000000
Total 415 415 100 415 100 74 17.83 341 82.17 0 0
Other than permanent employees
Male 00000000000
Female 0 0 0 0 0 0 0 0 0 0 0
Other 00000000000
Total 00000000000
b. Details of measures for the well-being of workers:
Permanent workers
Male 00000000000
Female 0 0 0 0 0 0 0 0 0 0 0
Other 00000000000
Total 00000000000
Other than permanent workers
Male 00000000000
Female 0 0 0 0 0 0 0 0 0 0 0
Other 00000000000
Total 00000000000
c. Spending on measures towards well-being of employees and workers (including permanent and other than permanent) in the following format:
             Category
 % of employees covered by
 Total (A)
  Health insurance
 Accident insurance
 Maternity benefits
 Paternity benefits
 Day care facilities
 Number (B)
  % (B/A)
  Number (C)
  % (C/A)
  Number (D)
  % (D/A)
  Number (E)
  % (E/A)
  Number (F)
  % (F/A)
                    Question
Cost incurred on well being measures as a % of total revenue of the company
2. Details of retirement benefits, for the current and previous financial year.:
PF Gratuity ESI
0.12
FY 2023 – 2024 (Current Financial Year)
FY 2022-2023 (Previous Financial Year)
    0.13
      Benefits
FY 2023 – 2024 (Current Financial Year)
FY 2022-2023 (Previous Financial Year)
       No. of employees covered as a % of total employees
No. of workers covered as a % of total workers
Deducted and deposited with the authority
No. of employees covered as a % of total employees
No. of workers covered as a % of total workers
Deducted and deposited with the authority
       100
100
Yes
   100
4
100
Yes
   100
Yes
      100 100 Yes
100 100 Yes
7 100 Yes
      Annual Report 2023-24 | 117
