
Page 272 - Arvind 2024
P. 272
Ahmedabad East LLP
March 31, 2023
March 31, 2023
March 31, 2023
March 31, 2024
13,756.87
8,685.25
5,071.62
1,772.23
3,299.39
3,276.14
23.26
1,168.87
473.83
695.04
242.88
452.17
185.39
266.78
1,834.18
627.31
1,206.87
278.08
928.79
-
928.79
-
-
-
-
-
-
-
0.72
388.01
(387.29)
(135.34)
(251.96)
(251.96)
-
-
-
-
-
-
-
-
-
148.29
(148.29)
(51.82)
(96.47)
(96.47)
-
March 31, 2024
1,207.37
(69.58)
(1,137.34)
0.45
3,178.59
0.83
(3,106.32)
73.10
(529.17)
0.00
492.48
(36.69)
-
-
-
-
(2,607.31)
(193.40)
3,134.45
333.75
-
-
-
-
(10,082.63)
-
10,153.71
71.08
March 31, 2024
9,068.45
7,606.85
12,998.16
58.83
3,618.31
3,413.43
204.88
6,070.29
5,170.68
9,427.69
-
1,813.28
(748.57)
2,561.85
5,254.19
6,557.43
8,457.10
-
3,354.52
(339.59)
3,694.10
-
-
-
-
-
-
-
6,522.59
3,979.52
7,579.51
15.42
2,907.18
(1,086.82)
3,994.00
-
-
-
-
-
-
-
9,086.66
2,904.32
1,786.48
-
10,204.50
5,199.58
5,004.92
March 31, 2023
March 31, 2023
Arvind Five Homes LLP
March 31, 2023
March 31, 2024
March 31, 2024
March 31, 2024
March 31, 2023
March 31, 2023
Adroda Homes LLP
March 31, 2023
March 31, 2024
March 31,
2024
March 31, 2024
March 31, 2023
March 31,
2023
Kalyangadh Homes LLP
March 31, 2023
March 31, 2024
March 31,
2024
March 31, 2024
Particulars
Particulars
Particulars
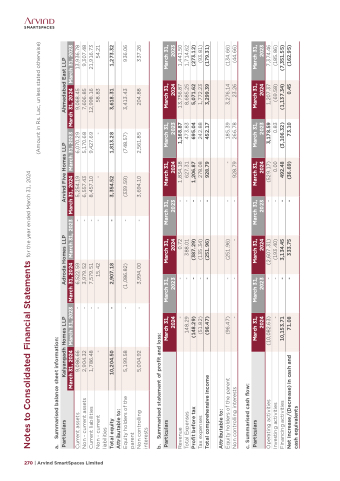
Notes to Consolidated Financial Statements for the year ended March 31, 2024 a. Summarised balance sheet information:
Current assets
Non - current assets Current liabilities
Non - current
liabilities
Total equity
Attributable to:
Equity holders of the
parent
Non controlling
interests
b. Summarised statement of profit and loss:
Revenue
Total Expenses
Profit before tax
Tax expenses
Total comprehensive income
Attributable to:
Equity holders of the parent
Non controlling interests
c. Summarised cash flow:
Operating activities
Investing activities
Financing activities
Net increase/(Decrease) in cash and
cash equivalents
(Amount in Rs. Lac, unless stated otherwise)
13,936.78 9,307.48 21,916.73 54.21
1,273.32
936.06 337.26
1,441.50 1,714.62 (273.12)
(93.81)
(179.31)
(134.66) (44.66)
7,374.46
(185.86)
(7,351.55) (162.95)
270 | Arvind SmartSpaces Limited
