
Page 224 - Arvind 2024
P. 224
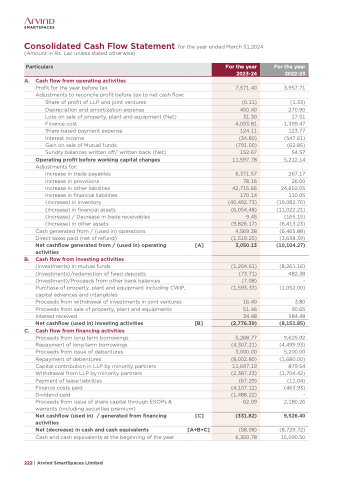
Consolidated Cash Flow Statement for the year ended March 31,2024 (Amount in Rs. Lac unless stated otherwise)
   Particulars
For the year 2023-24
124.11
For the year 2022-23
     7,571.40
  (0.11)
 450.40
 31.30
 4,093.81
  (34.80)
 (791.00)
 152.67
 11,597.78
  6,371.57
 (40,492.73)
78.16
 42,715.66
 170.14
  (6,054.48)
 9.45
 (9,826.17)
 4,569.38
 (1,519.25)
 3,050.13
  (1,204.61)
 (73.71)
 (7.08)
 (1,593.33)
 16.40
 51.46
 34.48
 (2,776.39)
  5,268.77
 (4,307.21)
 3,000.00
 (8,002.80)
 11,697.19
 (2,387.23)
 (67.29)
 (4,107.12)
 (1,488.22)
 62.09
 (331.82)
 (58.08)
 6,360.78
  A. Cash flow from operating activities
Profit for the year before tax
Adjustments to reconcile profit before tax to net cash flow:
Share of profit of LLP and joint ventures
Depreciation and amortization expense
Loss on sale of property, plant and equipment (Net)
Finance cost
Share based payment expense
Interest income
Gain on sale of Mutual funds
Sundry balances written off/ written back (Net)
Operating profit before working capital changes
Adjustments for:
Increase in trade payables Increase in provisions Increase in other liabilities Increase in financial liabilities (Increase) in inventory
(Increase) in financial assets
(Increase) / Decrease in trade receivables (Increase) in other assets
Cash generated from / (used in) operations Direct taxes paid (net of refund)
Net cashflow generated from / (used in) operating
activities
B. Cash flow from investing activities
(investments) in mutual funds
(Investments)/redemption of fixed deposits
(Investment)/Proceeds from other bank balances
Purchase of property, plant and equipment including CWIP, capital advances and intangibles
Proceeds from withdrawal of investments in joint ventures
Proceeds from sale of property, plant and equipments
Interest received
Net cashflow (used in) investing activities
C. Cash flow from financing activities
Proceeds from long term borrowings
Repayment of long term borrowings
Proceeds from issue of debentures
Repayment of debentures
Capital contribution in LLP by minority partners
Withdrawal from LLP by minority partners
Payment of lease liabilities
Finance costs paid
Dividend paid
Proceeds from issue of share capital through ESOPs & warrants (including securities premium)
Net cashflow (used in) / generated from financing activities
Net (decrease) in cash and cash equivalents
Cash and cash equivalents at the beginning of the year
[A]
3,957.71
(1.33) 270.90 17.51 1,399.47 123.77 (547.61) (62.85) 54.57 5,212.14
267.17 26.00 24,602.05 110.05 (19,082.70) (11,022.21) (165.15) (6,413.23) (6,465.88) (3,638.39) (10,104.27)
(8,261.16) 482.38 - (1,052.00)
3.80 90.65 584.48 (8,151.85)
9,625.92 (4,499.93) 5,200.00 (1,680.00) 879.54 (1,704.42) (11.04) (463.93) - 2,180.26
9,526.40
(8,729.72) 15,090.50
                                                                        [B]
                        [C]
[A+B+C]
       222 | Arvind SmartSpaces Limited
