
Page 196 - Arvind 2024
P. 196
Notes to Standalone Financial Statements for the year ended 31st March, 2024 (Amount in Rs. Lac, unless stated otherwise)
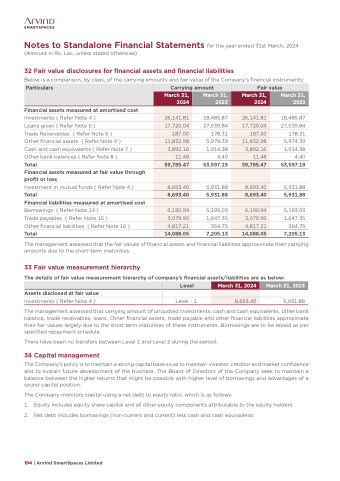
32 Fair value disclosures for financial assets and financial liabilities
Below is a comparison, by class, of the carrying amounts and fair value of the Company’s financial instruments:
Particulars
Carrying amount
March 31, 2024
Fair value
March 31, 2024
March 31, 2023
March 31, 2023
26,141.81
18,485.87
26,141.81
17,720.04
27,039.84
17,720.04
187.00
178.31
187.00
11,832.98
5,974.39
11,832.98
3,892.16
1,914.38
3,892.16
11.48
59,785.47
53,597.19
4.40
11.48
59,785.47
8,693.40
5,931.88
8,693.40
8,693.40
5,931.88
8,693.40
6,190.94
5,193.03
6,190.94
3,079.90
1,647.35
3,079.90
4,817.21
364.75
4,817.21
14,088.05
7,205.13
14,088.05
Financial assets measured at amortised cost
Investments ( Refer Note 4 )
Loans given ( Refer Note 5 )
Trade Receivables ( Refer Note 6 )
Other financial assets ( Refer Note 9 )
Cash and cash equivalents ( Refer Note 7 ) Other bank balances ( Refer Note 8 )
Total
Financial assets measured at fair value through profit or loss
Investment in mutual funds ( Refer Note 4 ) Total
Financial liabilities measured at amortised cost Borrowings ( Refer Note 14 )
Trade payables ( Refer Note 15 )
Other financial liabilities ( Refer Note 16 )
Total
18,485.87 27,039.84 178.31 5,974.39 1,914.38 4.40 53,597.19
5,931.88
5,931.88
5,193.03 1,647.35 364.75 7,205.13
The management assessed that the fair values of financial assets and financial liabilities approximate their carrying amounts due to the short-term maturities.
33 Fair value measurement hierarchy
The details of fair value measurement hierarchy of company’s financial assets/liabilities are as below:
Assets disclosed at fair value
Investments ( Refer Note 4 ) Level - 1 5,931.88
The management assessed that carrying amount of unquoted Investments, cash and cash equivalents, other bank balance, trade receivables, loans, Other financial assets, trade payable and other financial liabilities approximate their fair values largely due to the short term maturities of these instruments. Borrowings are to be repaid as per specified repayment schedule.
There have been no transfers between Level 1 and Level 2 during the period.
34 Capital management
The Company’s policy is to maintain a strong capital base so as to maintain investor, creditor and market confidence and to sustain future development of the business. The Board of Directors of the Company seek to maintain a balance between the higher returns that might be possible with higher level of borrowings and advantages of a sound capital position.
The Company monitors capital using a net debt to equity ratio, which is as follows:
1. Equity includes equity share capital and all other equity components attributable to the equity holders.
2. Net debt includes borrowings (non-current and current) less cash and cash equivalents
Level
March 31, 2024
March 31, 2023
8,693.40
194 | Arvind SmartSpaces Limited
