
Page 13 - Arvind 2024
P. 13
Corporate Overview
Statutory Reports Financial Statements
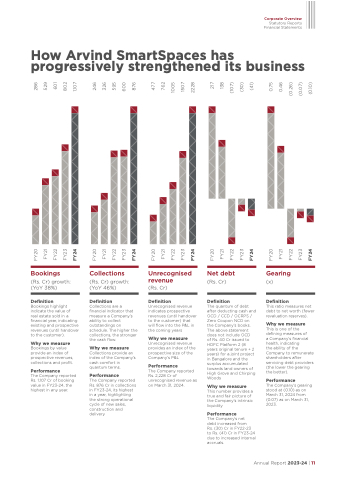
How Arvind SmartSpaces has progressively strengthened its business
Bookings
(Rs. Cr) growth: (YoY 38%)
Definition
Bookings highlight indicate the value of
real estate sold in a financial year, indicating existing and prospective revenues (until handover to the customer).
Why we measure
Bookings by value provide an index of prospective revenues, collections and profit.
Performance
The Company reported Rs. 1,107 Cr of booking value in FY23-24, the highest in any year.
Collections
(Rs. Cr) growth: (YoY 46%)
Definition
Collections are a financial indicator that measure a Company’s ability to collect outstandings on schedule. The higher the collections, the stronger the cash flow.
Why we measure
Collections provide an index of the Company’s cash comfort in quantum terms.
Performance
The Company reported Rs. 876 Cr in collections in FY23-24, its highest in a year, highlighting the strong operational cycle of new sales, construction and delivery
Unrecognised revenue
(Rs. Cr)
Definition
Unrecognised revenue indicates prospective revenues (until handover to the customer) that will flow into the P&L in the coming years
Why we measure
Unrecognised revenue provides an index of the prospective size of the Company’s P&L
Performance
The Company reported Rs. 2,228 Cr of unrecognised revenue as on March 31, 2024.
Net debt
(Rs. Cr)
Definition
The quantum of debt after deducting cash and OCD / CCD / OCRPS / Zero Coupon NCD on the Company’s books. The above statement does not include OCD
of Rs. 40 Cr issued to HDFC Platform 2 (8 years original tenure + 2 years) for a joint project in Bangalore and the surplus accumulated towards land owners of High Grove and Chirping Woods
Why we measure
This number provides a true and fair picture of the Company’s intrinsic liquidity
Performance
The Company’s net
debt increased from
Rs. (30) Cr in FY22-23 to Rs. (41) Cr in FY23-24 due to increased internal accruals.
Gearing
(x)
Definition
This ratio measures net debt to net worth (fewer revaluation reserves).
Why we measure
This is one of the defining measures of
a Company’s financial health, indicating
the ability of the Company to remunerate shareholders after servicing debt providers (the lower the gearing the better).
Performance
The Company’s gearing stood at (0.10) as on March 31, 2024 from (0.07) as on March 31, 2023.
Annual Report 2023-24 | 11
FY20 286 FY21 529 FY22 601 FY23 802 FY24 1,107
FY20 246 FY21 326 FY22 595 FY23 600 FY24 876
FY20 477 FY21 762 FY22 1005 FY23 1507 FY24 2228
FY20 217 FY21 138 FY22 (107) FY23 (30) FY24 (41)
FY20 0.75 FY21 0.46 FY22 (0.26) FY23 (0.07) FY24 (0.10)
